Life Expectancy
In the decades up to 2011, life expectancy increased steadily in England. Infectious-disease related deaths were common in the last century and were often preceded by a brief period of illness. Chronic non-communicable diseases are now the leading causes of mortality and are often preceded by long periods of severe to moderate illness prior to death.
Life expectancy (LE) and health life expectancy (HLE) are two important indicators that provide valuable insight into the health of a population. Life expectancy is the average number of years a person is expected to live and is a useful indicator of the overall health of a population. Life expectancy can be influenced by a variety of factors, including access to healthcare, behavioural risk factor, sex, race, and the environment.
In contrast, healthy life expectancy considers the quality of life in addition to the length of life. It is defined as the number of years a person is expected to live in good health, without significant disability or disease. This indicator can provide more information about the health status of a population and help identify areas where interventions are required to improve health outcomes overall (HM Government, 2017).
Life expectancy at birth
Life expectancy at birth is a statistical measure that estimates the average number of years a newborn is expected to live based on current mortality rates. Life expectancy at birth considers mortality rates at each age from birth to the end of a person's life. Life expectancy at birth for males in Bury for the period 2021-23 is 77.5 years, which is statistically worse than the England average of 79.1 years. For females during the same period, life expectancy is 81.3 years, also statistically worse than the England average of 83.1 years.
Examining data for Bury, life expectancy for both males and females has increased over the past two decades. However, females have consistently had a higher life expectancy than males from 2001 to 2023. The highest life expectancy for both sexes was recorded in the period 2017-19, with females at 82.2 years and males at 79 years. Life expectancy in males saw a sharp decline of 0.7 years in 2018-20 compared to 2017-19, and continued to decline until 2021-23, when there was an increase of 0.3 years to 77.5. Life expectancy in females followed a similar pattern, decreasing from 2018-20 to 2020-22, followed by a slight increase of 0.4 years in 2021-23 to 81.3 years.
Life expectancy at birth – Male (all ages)
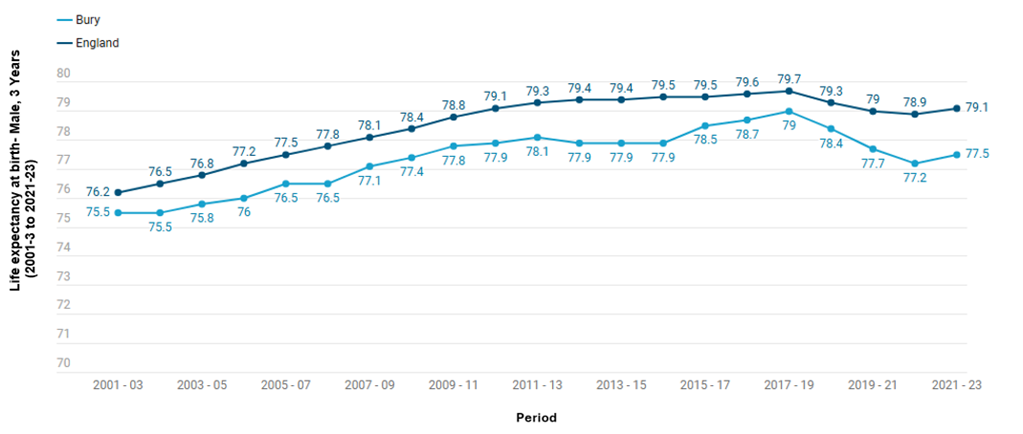
Life expectancy at birth for males in Bury for the period 2021-23 is 77.5 years, which is statistically lower than the England average of 79.1 years. Figure 1 presents the life expectancy of males in Bury and England. Throughout the time period 2001-03 to 2021-23, Bury’s male life expectancy has remained lower (statistically significant) than the average for England. Life expectancy in Bury increased from 75.5 years in 2001-03 to its peak at 79 years in 2017-19. This was followed by a steady decline to 77.2 years in 2020-22, and then a slight increase to 77.5 years in 2021-23. A fairly similar pattern was observed in England, where male life expectancy increased from 76.2 years in 2001-03 to its peak of 79.7 years in 2017-19. This was followed by the first decline in two decades to 78.9 years in 2020-21, and then a slight increase to 79.1 years in 2021-23.
Life expectancy in Bury for the period 2021-23 is the fourth lowest in its group of similar local authorities, with the highest male LE in Bracknell Forest of 81 years and the lowest in Tameside of 76.5 years (PHOF, 2023).
The gap between the LE in Bury and England has fluctuated throughout the years. In the early years of the period (2001-2005), the gap widened, reaching a peak of 1.6 years in 2014-16 and despite the gap narrowing since then, the gap widened again and reached the 1.6 years again in 2021-23.
Figure 1: Life expectancy at birth - Male (3 year range, all ages) in Bury compared with England, 2001-03 to 2021-23 (PHOF, 2023).
Life expectancy at birth – Female (all ages)
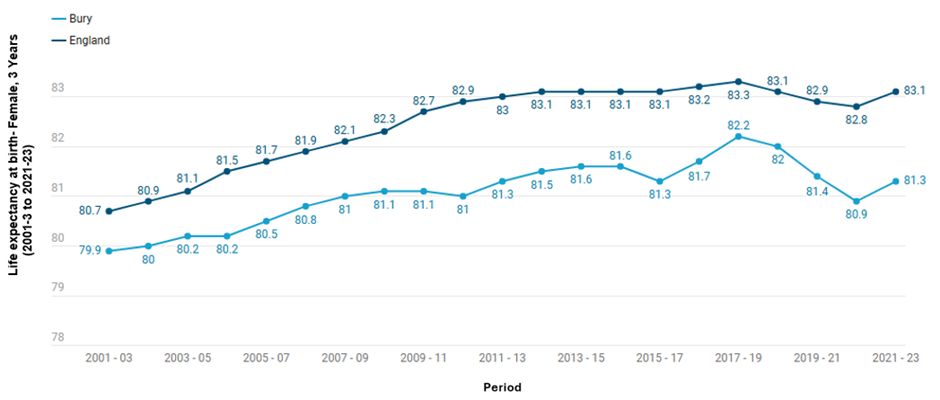
Life expectancy at birth for females in Bury for the period 2021-23 is 81.3 years, which is statistically lower than the England average of 83.1 years. Figure 2 presents the female life expectancy in Bury and England from the period 2001-03 to 2021-23. During this time period, female life expectancy in Bury has been consistently lower than the national average for England (statistically significant). Female life expectancy at birth in Bury increased from 79.7 years in 2001-03 to its peak at 82.2 years in 2017-19. This was followed by a decline to 80.9 years in 2020-22, and then a slight increase to 81.3 years in 2021-23. In England, female life expectancy increased from 80.7 years in 2001-03 to a peak of 83.3 years in 2017-19. This was followed by a slight decline to 82.8 years in 2020-22, and then a slight increase to 83.1 years in 2021-23. The gap between female life expectancy in Bury and England has not been consistent over time. In the early 2000s, the gap was relatively small, at around 0.8-0.9 years. However, from around 2009-11 onwards, the gap started to widen, reaching a peak of 1.9 years in 2010-12 and again in 2020-22. Since then, the gap has fluctuated, and in 2021-23 it was 1.8 years
Bury has the third lowest female life expectancy for the period 2021-23 in its group of 16 similar local authorities with the highest female LE in Bracknell Forest of 84.9 years, and the lowest in Tameside of 80.6 years (PHOF, 2023).
Figure 2: Life expectancy at birth - Female (3 year range, all ages) in Bury compared with England,, 2001-03 to 2021-23 (PHOF, 2023)
It is worth examining the causes of the slow rise in LE for both male and female in Bury and England around 2011-13 and the decline in LE observed in 2018-2020 (more pronounced for males in Bury).
Although there is limited evidence-base at Bury level, the slow rise in LE in England after the sharp gains from 1990s have been hotly debated. A review conducted by Public Health England (PHE) identified a number of factors that contributed to the slowing of life expectancy gains up until 2017. These factors include increasing numbers of older people vulnerable to influenza and other winter risks; slowing improvements in mortality from heart disease and stroke; widening inequalities; and rising death rates from accidental poisoning among younger adults (mainly due to drug misuse). It was noted that the slowdown affected most of the population at a time when health and social care services were facing unprecedented financial pressures and rising demand (HM Government, 2018). Other academic studies have linked the stall in increasing life expectancy and widening of life expectancy gaps to reductions in public spending, both in the UK and overseas (McCartney et al, 2022; Walsh et al, 2022; Alexiou et al, 2021)
The decline in LE observed in 2018-2020 appears to largely impact males in both Bury and England. In Western Europe, the COVID-19 pandemic triggered significant mortality increases in 2020 not seen since World War II. A recent study quantified the impact of COVID-19 through LE in 29 countries examining data from 2015-20 and concluded that males experienced larger life expectancy declines than females across most of the 29 countries. Most life expectancy reductions across different countries were attributable to official Covid deaths (Aburto et al, 2022)
Inequalities in life expectancy at birth
Life expectancy is a key measure of a population’s health status. Inequality in life expectancy is therefore one of the foremost measures of health inequality. Below we will examine inequalities in life expectancy by deprivation and geographies in Bury.
Deprivation
An area’s overall level of deprivation correlates closely with its life expectancy. People residing in affluent areas have a significantly longer life expectancy than those residing in deprived areas (Kings Fund, 2022). For Bury, this can be demonstrated using a "slope index of life expectancy inequality” indicating the disparity in life expectancy between the most deprived and least deprived population groups. The steepness of the slope depicts the deprivation related inequalities in life expectancy. The line would be horizontal if there were no inequalities.
Inequality in LE at birth for males by levels of deprivation in Bury has fluctuated over time, decreasing from 11.2 years in 2010-12 to 10.9 years in 2018-20 (PHOF, 2020). Similarly, it has also varied over time for females and has slightly increased from 8.4 years in 2010-12 to 8.5 years in 2018-20 (PHOF, 2020).
Male
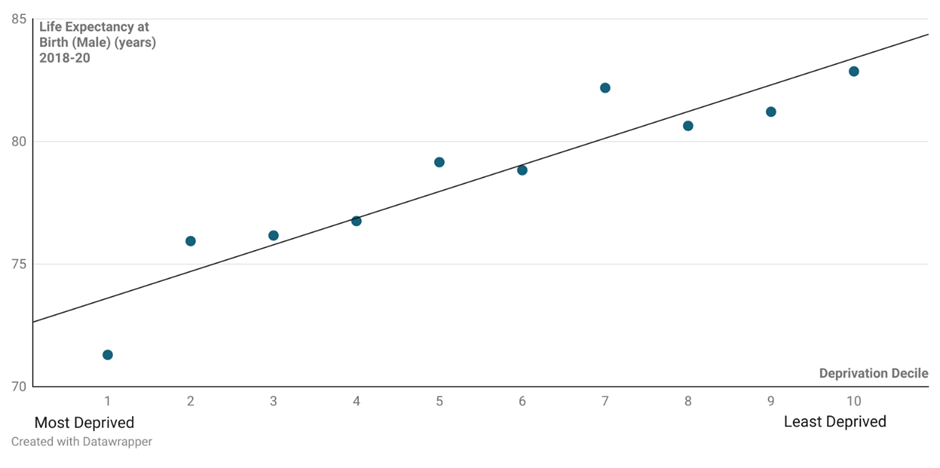
Figure 3 below presents life expectancy at birth for males across deprivation deciles in Bury for the three year period 2018-20, with decile 1 being the most deprived and decile 10 being the least deprived. Males born in the most deprived areas (decile 1) have a life expectancy of 71.3 years, which is the lowest among all the deprivation deciles. As the levels of deprivation decreases, the life expectancy increases. The highest life expectancy is observed in males in the least deprived areas (decile 10), with a life expectancy of 82.9 years.
The data suggests a deprivation gradient with individuals born in more deprived areas having lower life expectancies compared to those born in less deprived areas, but with a disproportionate effect seen in the most deprived decile. Data are currently being refreshed so data will be updated when available.
Figure 3: Life expectancy at birth – Male (3 year range, all ages) in Bury by levels of deprivation, 2018-20 (PHOF, 2020)
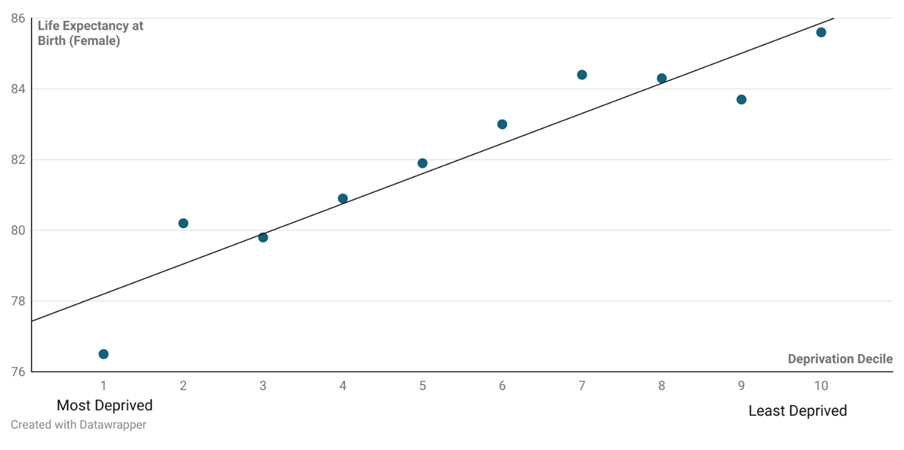
Female
Females born in the most deprived areas (decile 1) have a life expectancy of 76.5 years (5.2 years higher than males in the most deprived decile in Bury), which is the lowest among all the deprivation deciles. As the levels of deprivation decreases, the life expectancy increases. The highest life expectancy is observed in females in the least deprived areas (decile 10), with a life expectancy of 85.6 years (2.7 years higher than the LE for males in the least deprived decile in Bury). The data suggests a deprivation gradient with females born in more deprived areas having lower life expectancies compared to those born in less deprived areas, but with a disproportionate effect seen in the most deprived decile (Figure 4). Data are being refreshed so this section will be updated when available.
Figure 4: Life expectancy at birth – Female (3 year range, all ages) in Bury by levels of deprivation, 2018-20 (PHOF, 2020)
Gap in Life expectancy
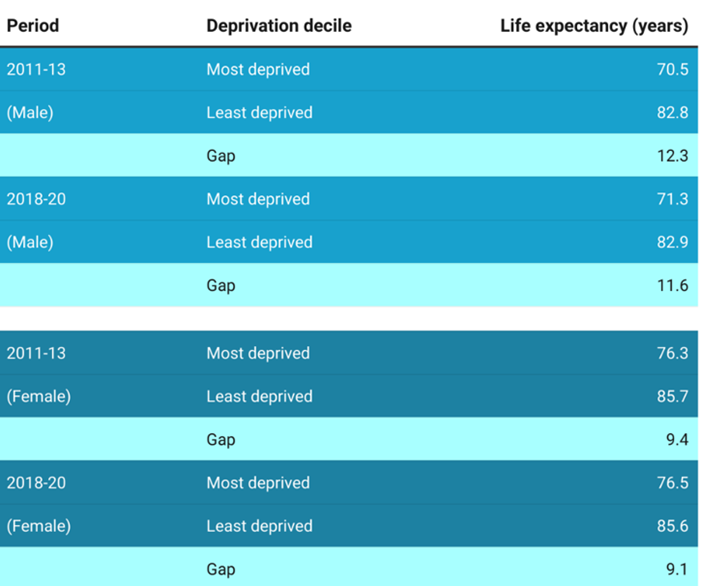
Table 1 below presents the life expectancy gap between the most deprived and least deprived deciles in two different three-year periods, 2011-2013 and 2018-2020. Data are broken down by sex, with separate statistics for males and females. Deprivation deciles are used to examine the experience of individuals, families or communities in terms of the level of deprivation of the area in which they live.
For males, in the 2011-13 period, the life expectancy for the most deprived decile was 70.5 years, while for the least deprived decile, it was 82.8 years. This represents a gap of 12.3 years between the two areas. In the 2018-20 period, the life expectancy for the most deprived decile was 71.3 years and for the least deprived decile was 82.9 years. This represents a slightly reduced gap of 11.6 years.
For females, in the 2011-13 period, the life expectancy for the most deprived decile was 76.3 years and for the least deprived decile, LE was 85.7 years. This represents a gap of 9.4 years between the two areas. In the 2018-20 period, the life expectancy for the most deprived areas was 76.5 years, while for the least deprived areas, it was 85.6 years. This represents a slightly reduced gap of 9.1 years.
Overall, the data shows that there is a significant gap in life expectancy between the most deprived and least deprived areas, with the gap being more pronounced for males than for females. However, the gap has slightly decreased over time for both sex.
Table 1: Gap in LE between the most and least deprived deciles in Bury for the period 2011-13 and 2018-20 by sex (PHOF, 2020)
Geography
Examining variations in life expectancy by small geographic areas can provide policymakers, public health officials, and community leaders with a valuable tool for identifying areas of need and targeting interventions and resources to improve health outcomes and reduce health disparities within a local area.
Local health profiles in fingertips provides LE data at ward and Middle layer Super Output Areas (MSOA) levels to examine these variations for both males and females. Bury has 17 wards, which are the primary unit of English electoral geography for civil parishes, borough and district councils and 26 MSOAs. Middle layer Super Output Areas are comprised of between 2,000 and 6,000 households and usually have a resident population between 5,000 and 15,000 persons. MSOAs fit within local authorities.
Life expectancy at birth for males during the period 2016-20 in Bury is one year lower (79 years) than England (80 years), whereas for females it is 1.5 years lower (81.7 years) than England (83.2 years). Life expectancy figures are presented as 5 years pooled data for males and females. However, the data are not timely as the last data reporting period is from 2016-20.
Wards
Male life expectancy at birth for Bury wards ranges from the lowest in Moorside (73.9 years) and East (74.6 years) to the highest in Ramsbottom (81.2 years) and Pilkington Park (81.7 years) (Figure 5).
Figure 5: Life expectancy at birth, (upper age band 90 and over) (Male) across 17 wards in Bury (5 years pooled data 2016-20) (Local health profiles, 2020)

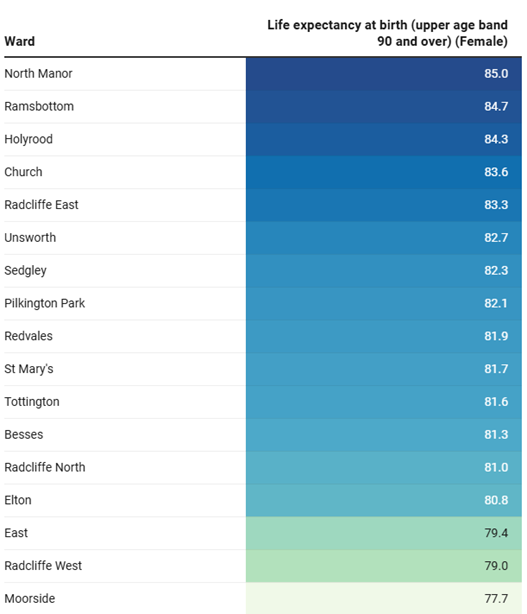
Female life expectancy at birth in Bury ranges from the lowest LE in Moorside (77.7 years) and Radcliffe West (79 years) to the highest in North Manor (85 years) and Ramsbottom (84.7 years) (Figure 6).
Figure 6: Life expectancy at birth, (upper age band 90 and over) (Female) across 17 wards in Bury (5 years pooled data 2016-20) (Local health profiles, 2020)
Middle Super Output Areas (MSOA)
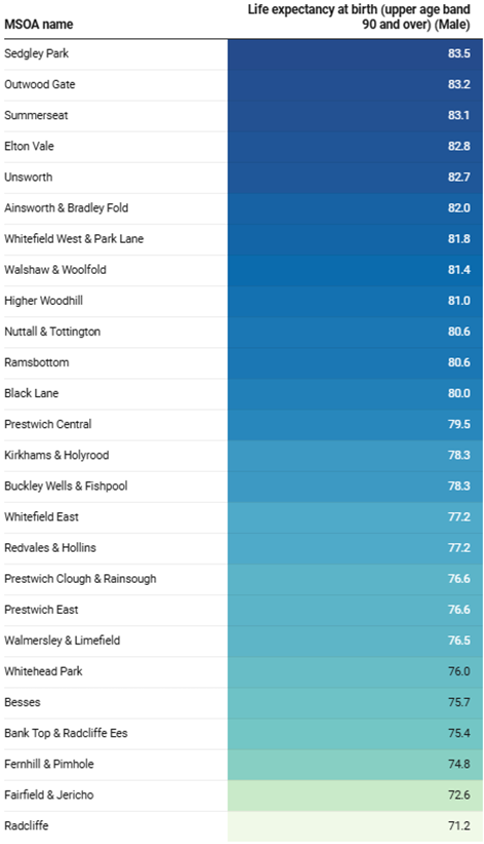
There are wide variations in male life expectancy at birth across MSOAs in Bury. The lowest life expectancy at birth for males is in Radcliffe (71.2 years), followed by Fairfield & Jericho (72.6 years). The highest life expectancy for males is in Sedgley Park (83.5 years) and Outwood Gate (83.2 years). Buckley Wells and Fishpool, along with Prestwich Central, are the most deprived MSOAs in Bury. (Figure 7).
Figure 7: Life expectancy at birth, (upper age band 90 and over) (Male) across 26 MSOAs in Bury (5 years pooled data 2016-20) (Local health profiles, 2020)
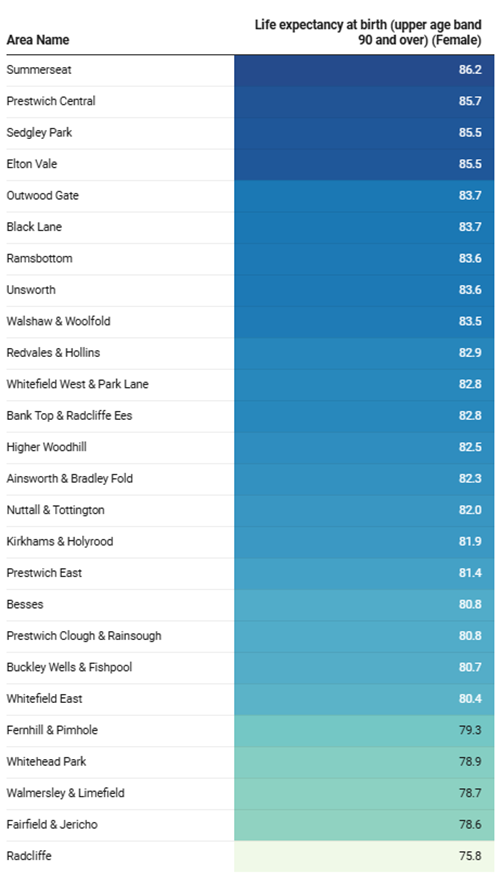
Female life expectancy at birth by MSOAs in Bury ranges from the lowest in Radcliffe (75.8 years) and Fairfield & Jericho (78.6 years) to the highest in Summerseat (86.2 years), followed by Prestwich Central (85.7 years) (Figure 8).
Figure 8: Life expectancy at birth, (upper age band 90 and over) (Female) across 26 MSOAs in Bury (5 years pooled data 2016-20) (Local health profiles, 2020)
Healthy Life Expectancy at Birth
Healthy life expectancy (HLE) at birth is a statistical measure of the number of years an individual is expected to live in good health, without significant illness and disability. This measure considers contemporary mortality rates and prevalence of self-reported good health, that is the rates of deaths and illness and provides a more comprehensive measure of population health than life expectancy alone.
‘Good health’ is a self-reported, subjective measure of health. Evidence suggests that it shows consistent association with more objective measures of health, but that inequalities in self-reported good health may underestimate more objective measures (Davillas et al, 2017). This could be because people get their idea of what counts as ‘good health’ from the health of people they see around them. Because it relies on self-reported health measured through surveys, no recent data on healthy life expectancy are available for smaller geographic areas or other small populations. For Bury, the most recent data on inequality in HLE at birth for both males and females available for the period 2009-2013.
Healthy life expectancy (HLE) at birth measure estimates the average number of years a new-born baby would live in good general health if he or she experienced the age-specific mortality rates and prevalence of good health for a specific location and time period throughout his or her lifetime. Deaths from all causes, midyear population estimates, and self-reported general health status are used to calculate figures based on three years of aggregated data. HLE figures reflect the prevalence of good health and mortality among those living in a geographical area during each time period, rather than what those born in the geographical area will experience throughout their lives. Since the health prevalence and mortality rates of the area are likely to change in the future and because many of those born in the area will live elsewhere for at least a portion of their lives, the figures do not accurately reflect the number of years a baby born in the area could expect to live in good general health.
HLE for males in Bury has decreased from 61.8 years in 2011-2013 to 59.3 years in 2021-2023, and it has also decreased for females (from 62.5 in 2011-13 to 60.1 years in 2021-23). HLE peaked for both males and females in 2018-20, with HLE for males being 62.7 years, and for females it was 63.6 years. From 2011-13 to 2021-23, females had a slightly higher healthy life expectancy than males. The gap between HLE in males and females has fluctuated over the time period, reaching its peak in 2013-15 when the gap was 1.2 years, and the lowest gap was between 2017-19 when it was just 0.3 years.
It is likely that a combination of demographic, behavioural and health-related factors contributed to the fluctuations in HLE observed in Bury and England. It is also possible that the COVID-19 pandemic and the cost-of-living crisis has had an impact on healthy life expectancy in Bury and England. While it may be early to fully assess the impact of the pandemic on HLE, it is likely that the pandemic has led to an increase in mortality and morbidity, especially among our older and vulnerable populations. The COVID-19 pandemic may also have indirect impacts on HLE due to disruptions to healthcare services, changes in behavioural risk factors due to social distancing and lockdowns, and economic hardships that can impact access to healthcare, healthy food options and consumption of alcohol, and physical activity. It is important to monitor and analyse the impact of the COVID-19 pandemic on HLE in Bury and England in the coming years, as this will provide valuable insights into the overall health status and wellbeing of the population.
Healthy Life Expectancy at Birth - Male (Years)
Healthy life expectancy at birth for males in Bury for the period 2021-23 is 59.3 years and statistically similar to England average of 61.5 years. Examining the trend for healthy life expectancy (HLE) at birth for males in Bury (Figure 9), there is a decline in HLE from 2013-15 to 2014-16, with HLE decreasing slightly from 61 years to 60 years. After that, there is an improvement in HLE, with it increasing to 61.6 years in 2015-17 and reaching its peak at 62.7 years in 2018-20. Since then, HLE for males in Bury has been gradually decreasing, reaching its lowest level yet at 59.3 years in the latest period of 2021-23. Bury has the fourth highest HLE at birth for males in its group of similar local authorities for the period 2021-23, with the highest HLE at birth for males in Stockport (62 years) and lowest in Rochdale (54.3 years) (PHOF, 2023).
In contrast, the trend for HLE at birth in England for males has remained relatively steady until 2019-2021 when HLE for England started to gradually decline and has reduced to 61.5 years for the latest time period of 2021-23.
Figure 9: Healthy life expectancy at birth - Male (years) in Bury compared with England, 2011-13 to 2021-23 (PHOF, 2023).
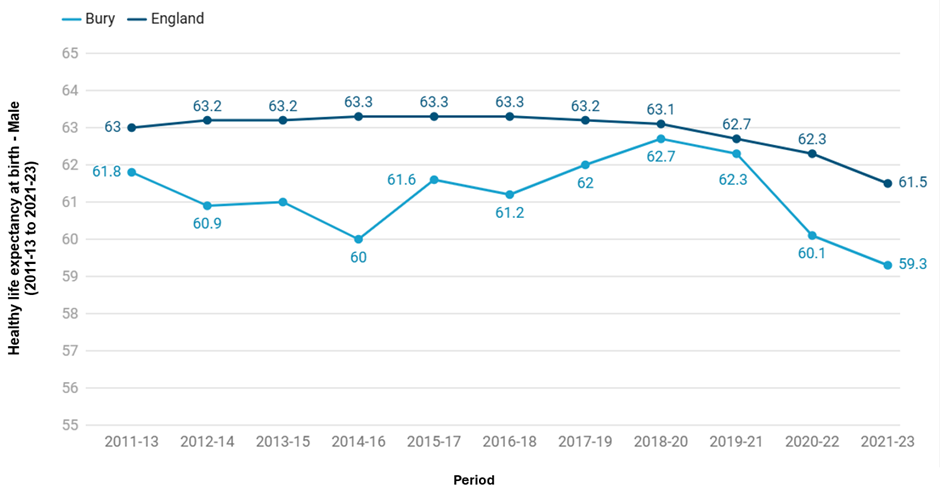
The gap between the HLE in Bury and England has fluctuated throughout the years. The gap started to widen in 2012-14 when it was 2.3 years. Between 2014-16 and 2016-18, the gap widened further, reaching its peak of 3.3 years in 2014-16. HLE in Bury males remained lower than England average (although not statistically significantly so) for the majority of the time periods from 2011-13 to 2021-23, with Bury only being classed as significantly worse than England for the time period 2014-16. The gap between Bury and the England average life expectancy narrowed and reached its lowest of only 0.4 years for the periods 2018-20 and 2019-21, followed by another increase for the two latest time periods with a gap of 2.2 years for 2020-22 and 2021-23.
Healthy life expectancy at birth – Female (Years)
Healthy life expectancy at birth for males in Bury for the period 2021-23 is 60.1 years and statistically similar to England average of 61.9 years. Figure 10 presents the female healthy life expectancy in Bury and England from the period 2011-13 to 2021-23. Female healthy life expectancy in Bury has been consistently lower than the national average for England (although not statistically significant) over the observed time period, with the exception of 2014-16 when Bury’s female HLE (60.8 years) was significantly worse than that for England (64.1 years). HLE for females in Bury has declined from 62.5 years in 2011-13 to 60.1 years in 2021-23. The national average for England has seen a similar decline, reducing from 63.9 years in 2011-13 to 61.9 years in 2021-23.
HLE for females in Bury has fluctuated over the years. The biggest increase was from 60.8 years in 2014-16 when it increased by 1.4 years to 62.2 years in 2015-17. This time period had followed the biggest decrease of 1.4 years when it decreased from 62.2 years in 2013-15. HLE for females in Bury reached its peak in 2018-20 when it was 63.6 years, which was followed by a gradual decline to 60.1 years in the latest time period 2021-23. Bury has the sixth highest HLE at birth for females in its group of similar local authorities for the period 2021-23, with the highest HLE at birth for females in Calderdale (63.2 years) and lowest in Rochdale (54.7 years) (PHOF, 2023).
In contrast, the trend in healthy life expectancy at Birth in females in England appears to be relatively stable for the observed time period until 2018-20, and it has seen a gradual decrease since then to 61.9 for 2021-23.
Figure 10: Healthy life expectancy at birth - Female (years) in Bury compared with England, 2011-13 to 2021-23 (PHOF, 2023).
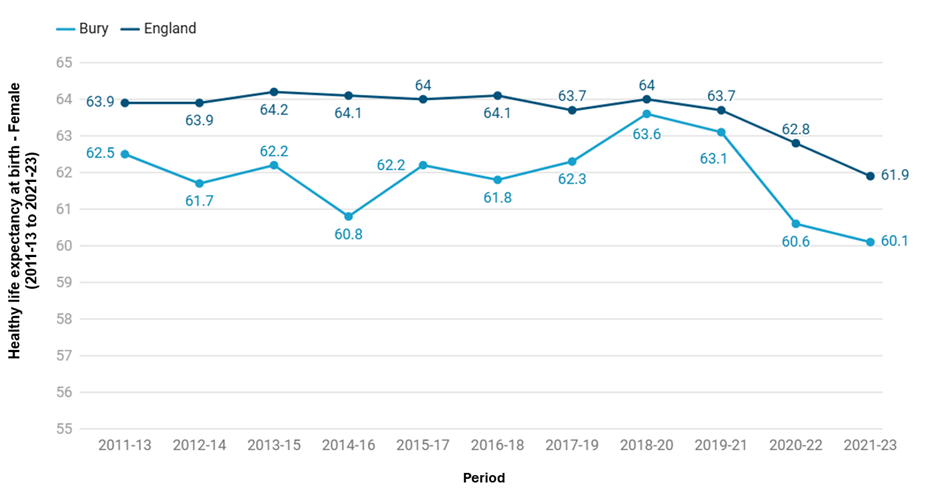
The gap between the Bury and England has varied over the observed time period, reaching its peak of 3.3 years difference for 2014-16, whereas 2018-20 demonstrated the smallest gap of only 0.4 years. There is a 1.8 year gap between HLE for females in Bury when compared to England for the latest time period of 2021-23.
Disability-free life expectancy at birth
Disability-free life expectancy at birth (DFLE) is a key indicator of health status and quality of life of a population considering not only the years of life but also the quality of life. It measures the number of years a person can expect to live without experiencing any disability or limitation in their activities of daily living. This includes both physical and mental impairments that can impact a person's ability to perform daily tasks.
The measure uses a prevalence of individuals without a disability derived from survey responses. It is an estimate of the average number of years a new-born would live without a disability for a specific location and time period if he or she experienced the age-specific mortality rates and disability free prevalence for that location and time period throughout his or her life. Deaths from all causes, mid-year population estimates, and self-reported disability are used to calculate figures based on data compiled over a three-year period. Figures reflect the prevalence of those without a disability and mortality among those living in an area during each time period, not what those born in the area will experience throughout their lives. The figures are not therefore the number of years a baby born in the area could expect to live disability free, both because the prevalence and mortality rates of the area are likely to change in the future and because many of those born in the area will live elsewhere for at least some part of their lives (PHOF, 2023).
Disability-free life expectancy at birth - Male (All Ages)
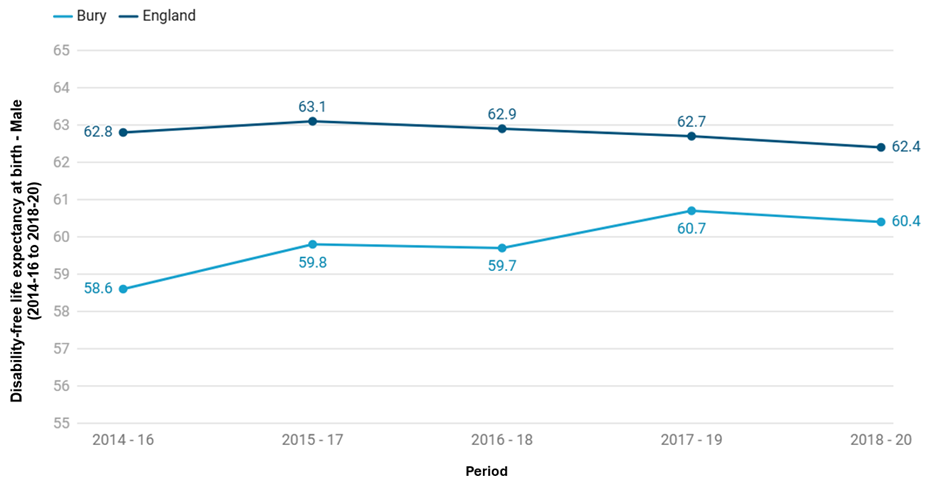
Disability-free life expectancy at birth for males in Bury during the period 2018-20 is 60.4 years and statistically similar to England average of 62.4 years. Figure 11 presents the DFLE of males in Bury and England for the period 2014-16 to 2018-20. DFLE in Bury increased from 58.6 years in 2014-15 to 60.7 years in 2017-19 (remaining below the England average throughout this time period) before decreasing slightly to 60.4 years in 2018-2020. For England, disability-free life expectancy at birth for males remained fairly stable over the same period, from 62.8 years in 2014-2016 to 62.4 years in 2018-2020, with some fluctuations in between. DFLE in Bury for the period 2018-20 is the 6th highest in its group of similar local authorities with the highest male DFLE in Bedford of 65.4 years and the lowest in Rotherham of 56.3 years (PHOF, 2020).
Figure 11: Disability-free life expectancy at birth - male (years) in Bury compared with England, 2014-16 to 2018-20 (PHOF, 2020).
Disability-free life expectancy at birth – Female (all ages)
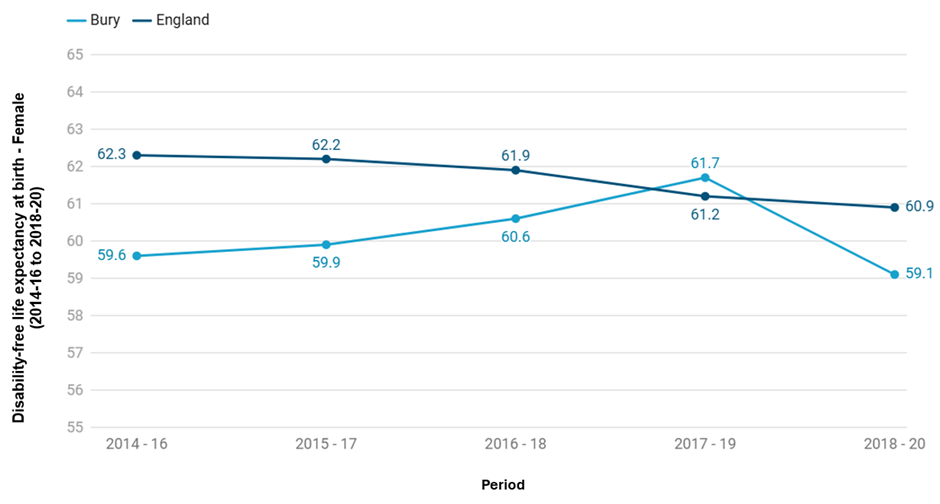
Disability-free life expectancy at birth for males in Bury during the period 2018-20 is 59.1 years and statistically similar to England average of 60.9 years. Figure 12 presents the DFLE of females in Bury and England for the period 2014-16 to 2018-20. DFLE in Bury females increased from 59.6 years in 2014-15 to 61.7 years in 2017-19 before decreasing to 59.1 years in 2018-2020 (statistically comparable to the England average). For England, disability-free life expectancy at birth decreased consistently from 62.3 years in 2014-2016 to 60.9 years in 2018-2020. DFLE for females in Bury for the period 2018-20 is the 7th highest in its group of similar local authorities with the highest female DFLE in Bedford of 61.9 years and the lowest in Doncaster of 53.3 years (PHOF, 2020).
Figure 12: Disability-free life expectancy at birth - female (years) in Bury compared with England, 2014-16 to 2018-20 (PHOF, 2020).
Inequalities in disability-free life expectancy at birth
There are no publicly available data on inequalities in DFLE at birth for both males and females at Bury and England levels.
Life Expectancy at 65
This is the average number of years a person would expect to live based on contemporary mortality rates. For a particular area and time period, it is an estimate of the average number of years a person at age 65 would survive if he or she experienced the age specific mortality rates for that area and time period throughout his or her life after that age.
Figures reflect mortality among those living in an area in each time period, rather than what will be experienced throughout life among those born in the area. The figures are therefore the number of years a baby born in the area could actually expect to live, both because the mortality rates of the area are likely to change in the future and because many of those born in the area will live elsewhere for at least some part of their lives.
Life expectancy at 65 – Male (Years)
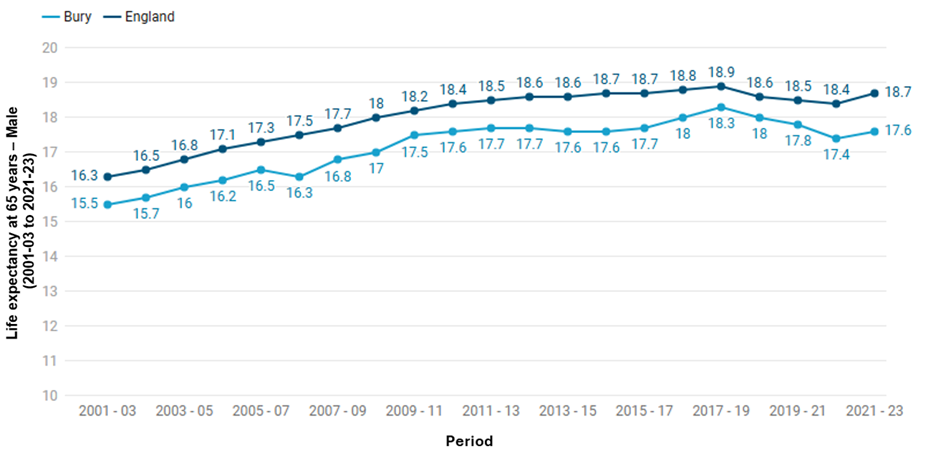
Life expectancy at 65 for males (3 years range) in Bury during the period 2021-23 is 17.6 years and statistically lower compared to England average of 18.7 years. Figure 13 below presents male life expectancy at 65 for Bury and England from the period 2001-03 to 2021-23. Life expectancy at 65 for males in Bury increased steadily from 15.5 years in 2001-03 to its peak at 18.3 years in 2017-19. This was followed by a decline to 17.4 years in 2020-22. In 2021-23 it increased slightly back to 17.6 years. These rates follow the pattern of England but are significantly worse than England for all years. Compared to Bury’s group of similar local authorities, Bury has the thirds lowest life expectancy at 65 for males for 2021-23 at 17.6 years. Stockport is the highest at 18.7 years, equal to England and Rochdale is the lowest at 17 years (PHOF 2023).
Figure 13: Life expectancy at 65 years - male (3 years range) in Bury compared with England, 2001-03 to 2021-23 (PHOF, 2023)
Life expectancy at 65 – Female (Years)
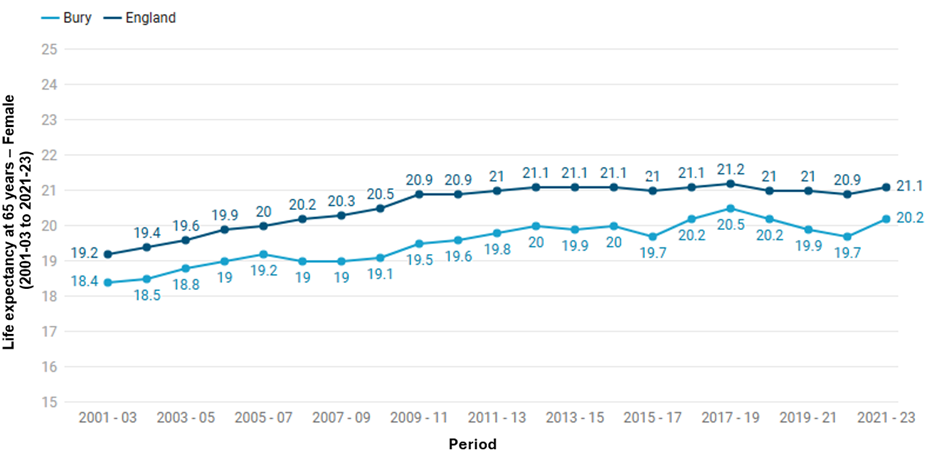
Life expectancy at 65 for females (3 years range) in Bury during the period 2021-23 is 20.2 years and statistically lower compared to England average of 21.1 years. Figure 14 presents the female life expectancy at 65 years from the period 2001-03 to 2021-23 for Bury and England. Initially, life expectancy at 65 years in Bury increased from 18.4 years in 2001-03 to a peak of 20.5 years in 2017-19. Following this peak, there was a decline to 19.7 years in 2020-22. However, the trend reversed slightly, with life expectancy rising again to 20.2 years in 2021-23. These rates are significantly worse than England for all years with the gap between them fluctuating. Compared to Bury’s group of similar local authorities, Bury has the 8th lowest life expectancy for 2021-23 at 20.2 years. Stockport is again the highest at 21.5 years and Halton is the lowest at 19.5 years (PHOF, 2023).
Figure 14: Life expectancy at 65 years - female (3 years range) in Bury compared with England, 2001-03 to 2021-23 (PHOF, 2023)
Healthy life expectancy at 65
Healthy life expectancy at 65 is a measure of the average number of years a person aged 65 years would expect to live in good health based on contemporary mortality rates and prevalence of self-reported good health.
The prevalence of good health is derived from responses to a survey question on general health. For a particular area and time period, it is an estimate of the average number of years a person aged 65 years would live in good general health if he or she experienced the age specific mortality rates and prevalence of good health for that area and time period throughout his or her remaining life. Figures are calculated from deaths from all causes, mid-year population estimates, and self-reported general health status, based on data aggregated over a three year period.
Healthy life expectancy at 65 – Male (Years)
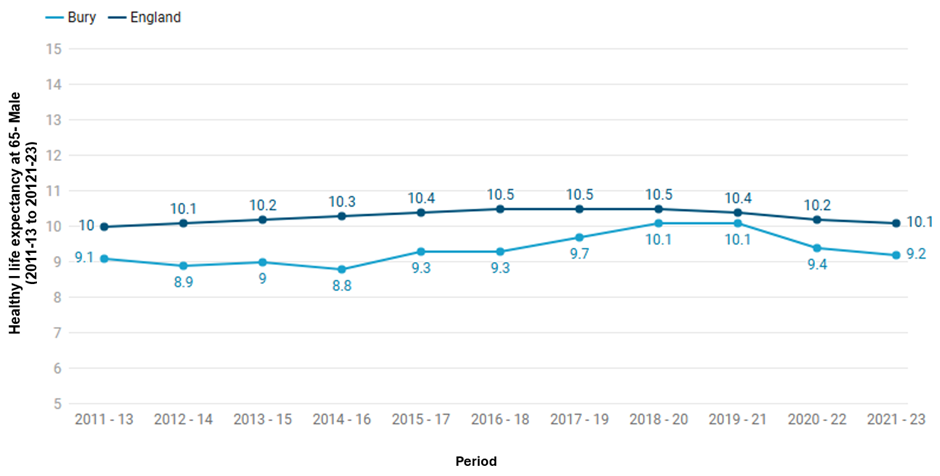
Healthy life expectancy at 65 years (male) for the period 2021-23 in Bury is 9.2 years, statistically similar to England average of 10.1 years. Figure 15 presents the trend in male life expectancy at age 65 in Bury from 2011-13 to 2021-23. Initially, life expectancy at 65 fluctuated slightly, starting at 9.1 years in 2011-13 and decreasing to 8.8 years in 2014-16. It then increased to a peak of 10.1 years in 2018-20 and 2019-21, with the narrowest gap with England during this time period. Following the peak, there was a decline to 9.4 years in 2020-22, but the trend reversed slightly, with life expectancy rising again to 9.2 years in 2021-23. Throughout the reported time period, Bury life expectancy at 65 years for males was similar (statistically significant) compared to England average.
For 2021-23, Bury has the fourth lowest healthy life expectancy at 65 for males when compared to its group of similar local authorities. Bracknell Forest has the highest at 11.9 years and Rochdale has the lowest at 8 years (PHOF, 2023)
Figure 15: Healthy life expectancy at 65 - male (years) in Bury compared with England, 2011-13 to 2021-23 (PHOF, 2023)
Healthy life expectancy at 65 – Female (Years)
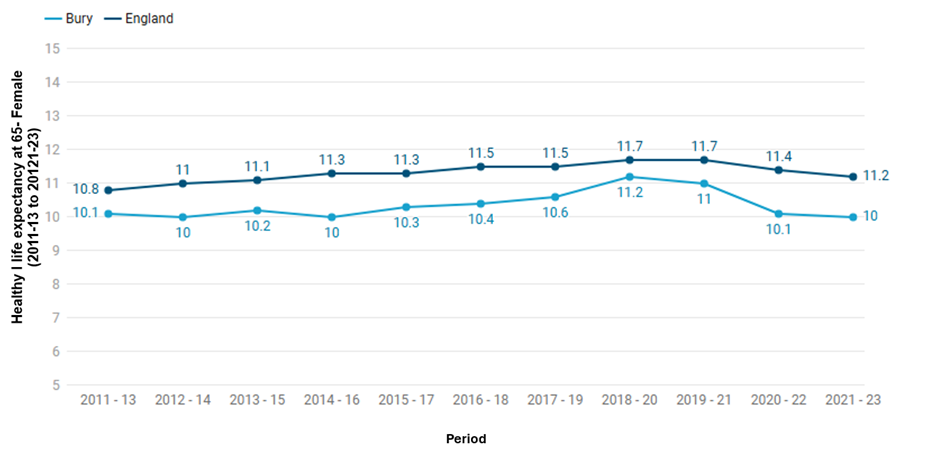
Healthy life expectancy at 65 years (male) for the period 2021-23 in Bury is 10years, statistically similar to England average of 11.2 years. Figure 16 presents the female healthy life expectancy at 65 for Bury and England during the period 2011-13 to 2018-20. Initially, healthy life expectancy fluctuated slightly, starting at 10.1 years in 2011-13 and to a peak of 11.2 years in 2018-20 during which Bury had the lowest gap with England. Following this peak, there was a steady decline to 10 years in 2021-23. For 2021-23, Bury has the 7th lowest healthy life expectancy at 65 for females when compared to its group of similar local authorities. Bracknell Forest is the highest at 13.1 years and Rochdale is the lowest at 8.3 years (PHOF, 2023)
Figure 16: Healthy life expectancy at 65 - female (years) in Bury compared with England, 2011-13 to 2021-23 (PHOF, 2023)
Disability-free life expectancy at 65 years
Disability free life expectancy (DFLE) is an estimate of the number of years a person aged 65 years would expect to live without a long lasting physical or mental health condition or disability limiting their ability to carry out day to day activities. This is based on contemporary mortality rates and prevalence of self-reported disability free state.
The prevalence of disability free state is derived from responses to a survey question on general health. or a particular area and time period, it is an estimate of the average number of years a person aged 65 years would live without disability if he or she experienced the age specific mortality rates and prevalence of disability free state for that area and time period throughout his or her remaining life. Figures are calculated from deaths from all causes, mid year population estimates, and self-reported disability free state, based on data aggregated over a three year period.
Disability-free life expectancy at 65 – Male (Years)
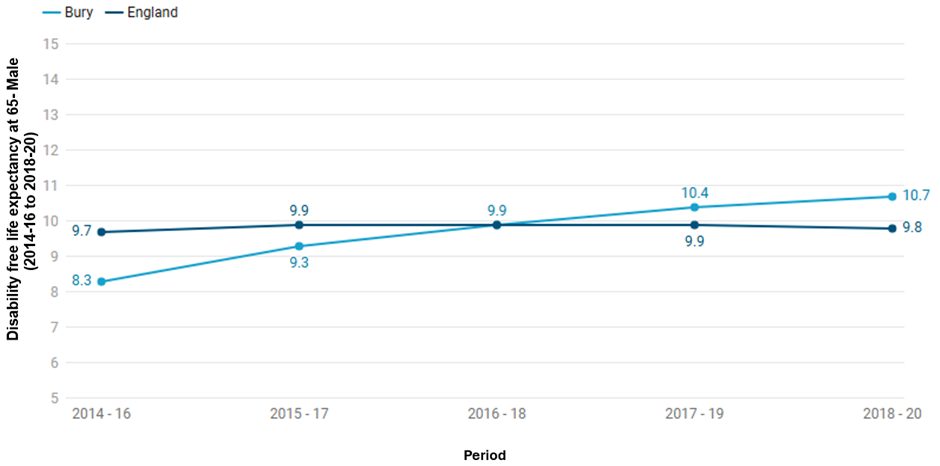
Disability free life expectancy (DFLE) at 65 years for male for the period 2018-20 in Bury is 10.7 years, statistically similar to England average of 9.8 years. Figure 17 presents the male disability-free life expectancy (DFLE) at 65 years in Bury and England for the period 2014-16 to 2018-20. In 2014-16 males in Bury had 8.3 years of disability-free life expectancy significantly worse than England average for this time period. From 2015-17, DFLE in Bury steadily increased from 9.3 years to 10.7 years in 2018-20. There are no recent data available for Bury.
For the period 2018-20, Bury had the third highest DFLE at 65 for males at 10.7 years when compared to its group of similar local authorities. Swindon was the highest at 11.2 years and Oldham was the lowest at 7.6 years. (PHOF, 2020)
Figure 17: Disability-free life expectancy at 65 - male (years) in Bury compared with England 2014-16 to 2018-20 (PHOF, 2020)
Disability-free life expectancy at 65 – Female (Years)
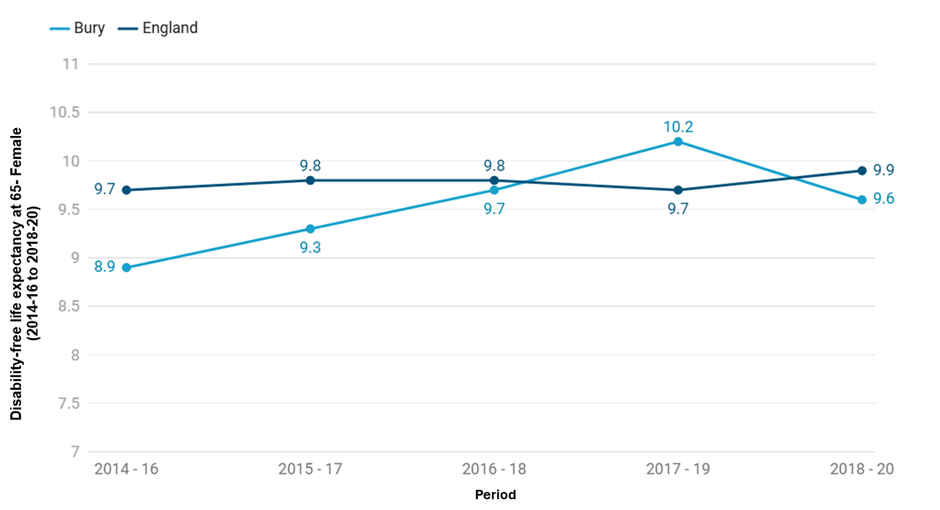
Disability free life expectancy (DFLE) at 65 years for female for the period 2018-20 in Bury is 9.6 years, statistically similar to England average of 9.9 years. Figure 19 presents the female disability-free life expectancy (DFLE) at 65 in Bury and England for the period 2014-16 to 2018-20. From 2014-16 to 2017-19, DFLE at 65 years for females in Bury increased from 8.9 years to 10.2 years. This was followed by a decline to 9.6 years in 2018-20. There are no recent data available after this period. For 2018-20, Bury had the fifth highest DFLE at 65 for females at 9.6 years when compared to its group of similar local authorities. Beford was the highest at 11 years and Doncaster was the lowest at 6.5 years. (PHOF, 2020)
Figure 18: Disability-free life expectancy at 65 - female (years) in Bury compared with England 2014-16 to 2018-20 (PHOF, 2020)